
2023 Club Excellence - A Statistical Analysis

Introduction
What goes into a team making the Club Excellence list? Have you ever asked a fellow coach (or yourself), “I wonder how much club size plays a part in achieving Club Excellence?” or “What sets a Gold Medal Club apart from a Silver Medal Club and Silver from Bronze?” If you are even a little curious about these questions and others, this article is for you.
The 2023 Club Excellence List (found here) has been out for over a month, but the context surrounding who these clubs are has yet to be detailed. Sure, we know “how” USA Swimming selected these clubs (noted here), but can we say “why” they were selected?
Summary of Findings
Let’s cut to the chase: we uncover several findings in this analysis, but let’s put them in context before we go any further. From a coach/team leader perspective, the evidence presented supports three sound conclusions:
- Club size plays a part in Club Excellence, but the relationship is not strictly “the bigger club always has more Club Excellence points.”
- The smallest Gold Medal club has fewer than 100 swimmers; high performance is possible even with a small team.
- Long course racing opportunities mean everything.
- On the surface, it seems like a no-brainer that Club Excellence points are tightly correlated (definition below in Glossary) with higher numbers of long course meets. However, if those coaches and athletes aren’t making daily progress at practice, then just attending more meets does not necessarily mean improved Club Excellence standing.
- There is no substitute for coaching experience.
- Employing and retaining great coaches can be challenging in this sport, but it makes a difference. Continual investment in your coaching staff will yield outsized results from your athletes.
Baseline Statistics
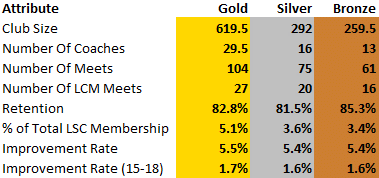
For starters, here are some simple averages (median is used here for average - please note the explanation in the Glossary as to why) of club teams within different medal groupings.
The Truth About Club Size
First, let’s examine a widely held belief that more swimmers = more Club Excellence points. Without a doubt, a larger team equates to a more successful team, right? Well, let’s look at the data:
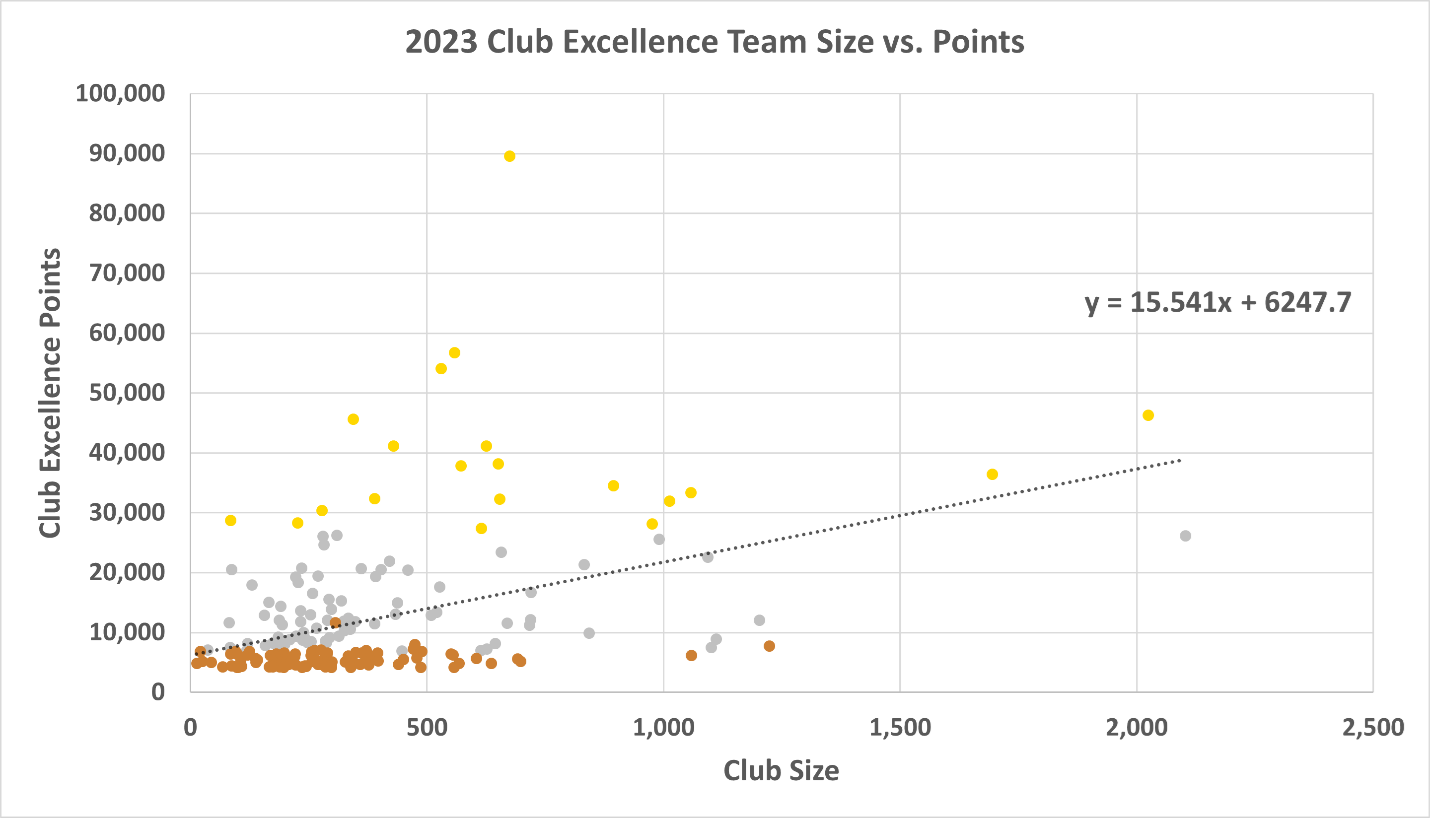
Okay, so there’s a bunch of different colored dots in the lower left-hand corner: what does that mean? From this data, we notice that, generally, as club size increases, Club Excellence points also tend to increase. This finding is supported by a correlation (r) value of 0.42, signaling a weak positive correlation between club size and Club Excellence points scored. However, when we break this down further and examine correlations within each medal grouping, we observe the following correlation values:
- Gold: 0.06
- Silver: 0.28
- Bronze: 0.22
When comparing these individual results to the cumulative correlation value of 0.42, we notice that all three values are lower than the total correlation! So, what does this tell us? This data suggests that a higher club size is weakly associated with a higher Club Excellence score, but once you hit a given “medal minimum” size, club size is largely irrelevant to your club’s progress within a medal tier. These results are also consistent for the previous two Club Excellence seasons.
What Separates Clubs?
Now that we’ve discussed club size let’s explore other factors that may help explain these results. We considered all the variables listed in the glossary below for this analysis.
Of these variables, three had a higher correlation (r) value than raw club size:
- Number of Coaches (0.44)
- Number of Total Meets (0.44)
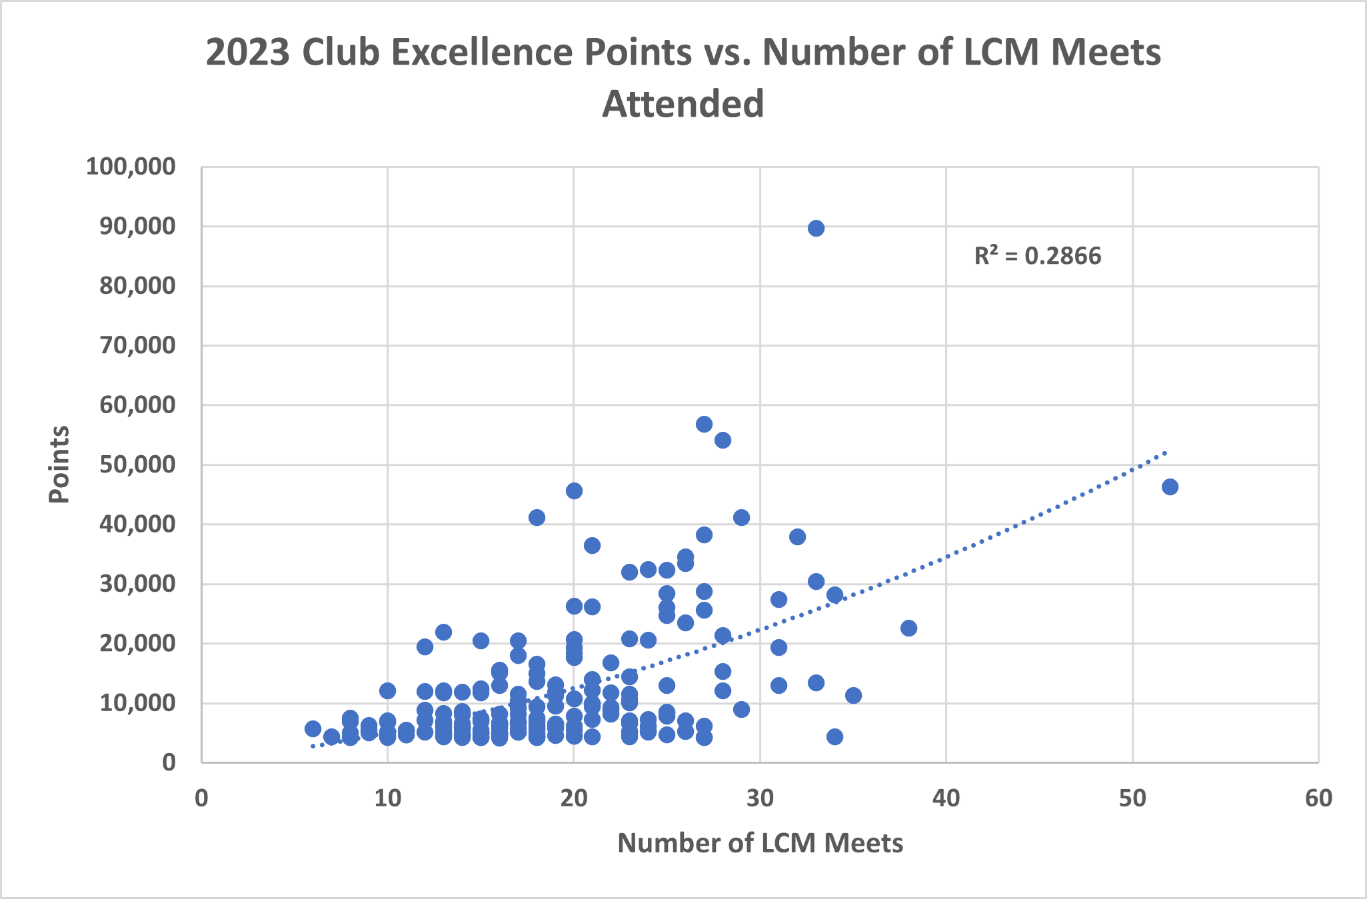
- And the one that really stuck out - Number of LCM Meets (0.53)
So there you have it: more swimmers + more coaches + more meets (especially long course) = more Club Excellence points, right? Not quite.
To take it a step further, we constructed simple linear regression and multiple linear regression models to assess how well these variables explain the club’s total Club Excellence points. However, before we take a deeper dive, we first had to measure the similarities of these variables. As you might expect, club size and the number of coaches are tightly correlated. We only want to include one of these variables in the model since they tell us the same information. We used the same methodology to remove several other variables.
In the modeling phase, we used numerous combinations of variables, but the best model turned out to be one with only three variables; two of these variables (Club Size and Number of LCM Meets) should come as no surprise, but the third (Average Years of Coaching Experience) may surprise you. Once we control for the effect Club Size and long course meets have on Club Excellence points, coaching experience becomes a significant piece of the equation.
Glossary of Terms / Disclaimers
Below, you will find a definition for all variables and any relevant statistical terms you may have encountered throughout the article:
Variables Considered:
- Number of Coaches
- Total Year over Year Improvement Rate of all swimmers on a given club
- To calculate this, we used a swimmer’s season-best time in a given event in the 2021-2022 season as the baseline. Then, we used that same swimmer’s season-best time in 2022-2023 to compare to the baseline. We used the average across every swimmer in every event as the club’s overall rate of improvement.
- Let’s say we have a 15-year-old boy who went a season-best 50.00 in the 100 Free (SCY) in the 2021-2022 season. That same boy then swims a season-best of 49.00 in the 2022-2023 season. His year-over-year rate of improvement would be (50 - 49) / 50 = 2%.
- To calculate this, we used a swimmer’s season-best time in a given event in the 2021-2022 season as the baseline. Then, we used that same swimmer’s season-best time in 2022-2023 to compare to the baseline. We used the average across every swimmer in every event as the club’s overall rate of improvement.
- Aged 15-18 Year over Year Improvement Rate
- Calculated the same way as above; highlighted what is likely the club’s “senior” group to see if this relates to Club Excellence points.
- Average Years of Coaching Experience
- Sum Total years of coaching experience of all coaches / Number of coaches
- % of Total LSC Membership
- # of Club’s members / # of LSC’s members
- % of Total 12U LSC Membership
- Same as above, except for athletes aged 12 and Under. The thesis here is that a strong club base = high performance at a later age
- Club Size = Total # of Athletes on a given Club (2023 Season)
- Total # of 12U Athletes on a given Club (2023 Season)
- Year over Year club retention rate (2023 Season)
- For this analysis, retention is defined as (# of renewing members this year) / (# of total members last year)
- Year over Year 12U club retention rate (2023 Season)
- Same definition as above, just 12U athletes instead of all athletes
- Total # of meets competed in (2023 Season)
- Distinct count of all meets that a given club had at least one athlete attend in the 2023 season
- Total # of LCM meets competed in (2023 Season)
- Same as above, except just long course meets
Statistical Terms
- Median
- The middle value in a sorted list of numbers. For example, if we have a dataset containing {0,1,1,1,1,3,14}, the median of this would be 1 (the middle number). The mean, traditionally considered the “average,” would be the sum of all these numbers divided by the count of numbers (21/7) = 3.
- In our case, the median was chosen to represent the average due to the nature of our data. See the below example for context:
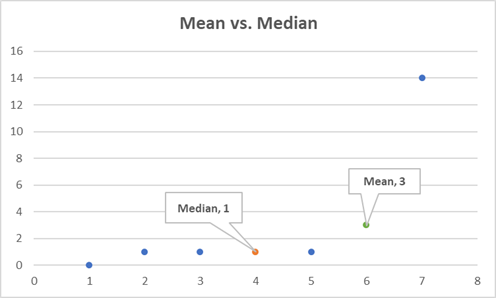
- Here, you can see that we have some outlier data, which drastically changes the mean value but not the median. Wouldn’t you agree that 1 is a more accurate representation of the average of the group than 3 is?
- Correlation (r)
- A numeric representation of the association between two data points. The range of possible values is -1 to 1, where -1 is a perfect negative correlation and, 1 is a perfect positive correlation. Let’s see some examples:
- Perfect Positive: Say a swimmer swims the 100 fly ten times in their career. Every time they swim the 100 fly, they go a lifetime best time. The correlation value then between # of times swum the 100 fly and # of best times = 1, since they were 100% on best times.
- Perfect Negative: Let’s say that as a club, we charge $100 a month for a kid to swim in each practice group. Say that, for whatever reason, five kids decide swimming is not for them and we have to refund them. Thus, for every kid we refund, we lose $100. This is a perfect negative correlation: for every 1 kid that we refund, we know we will lose exactly $100.
- General examples of positively correlated variables (one increases, the other increases too): smoking & lung cancer, height & vertical reach, and # of bedrooms & home price.
- General examples of negatively correlated variables (one increases, the other decreases): miles driven & gallons of gas left, golf skill and golf score, and amount of money spent & amount of money left.
- A numeric representation of the association between two data points. The range of possible values is -1 to 1, where -1 is a perfect negative correlation and, 1 is a perfect positive correlation. Let’s see some examples:
Limitations of this analysis: As any statistics student would tell you - correlation does not equal causation. This analysis studied several factors that may impact Club Excellence standing. Still, we have yet to come close to studying all factors that may play a role here (club proximity to a major metropolitan area, team structure, number of facilities, etc.). This study aims to be informative and thought-provoking but not at all prescriptive.
Thanks for reading! Please email stats@usaswimming.org with any questions or comments.